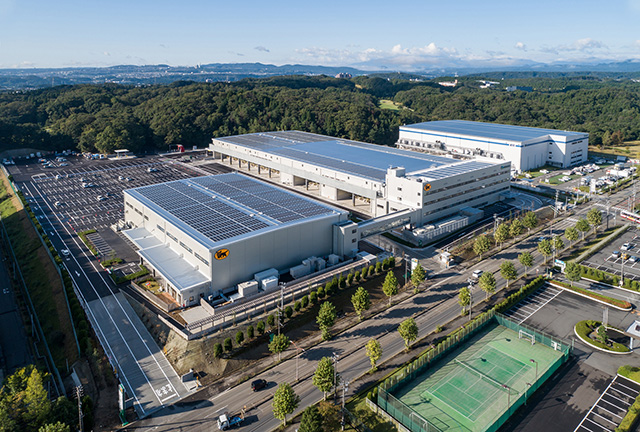

A unique leading indicator is born. With its first monthly survey in July 2007, we tapped into insights from a previously unexplored area of the economy: usage of America’s logistics facilities. By asking our customers about their activity levels and space utilization, we have shed light on the velocity and volume of goods flowing through the nation’s supply chains and our industry and portfolio. Consumption comprises more than 70 percent of the U.S. economy1, and nearly all consumer goods spend time in at least one (but more often multiple) logistics facilities. The Prologis Industrial Business Indicator (IBI)™ has proven to be a reliable leading indicator of not only demand for logistics real estate but also the state of the overall U.S. economy.
Close Business Links
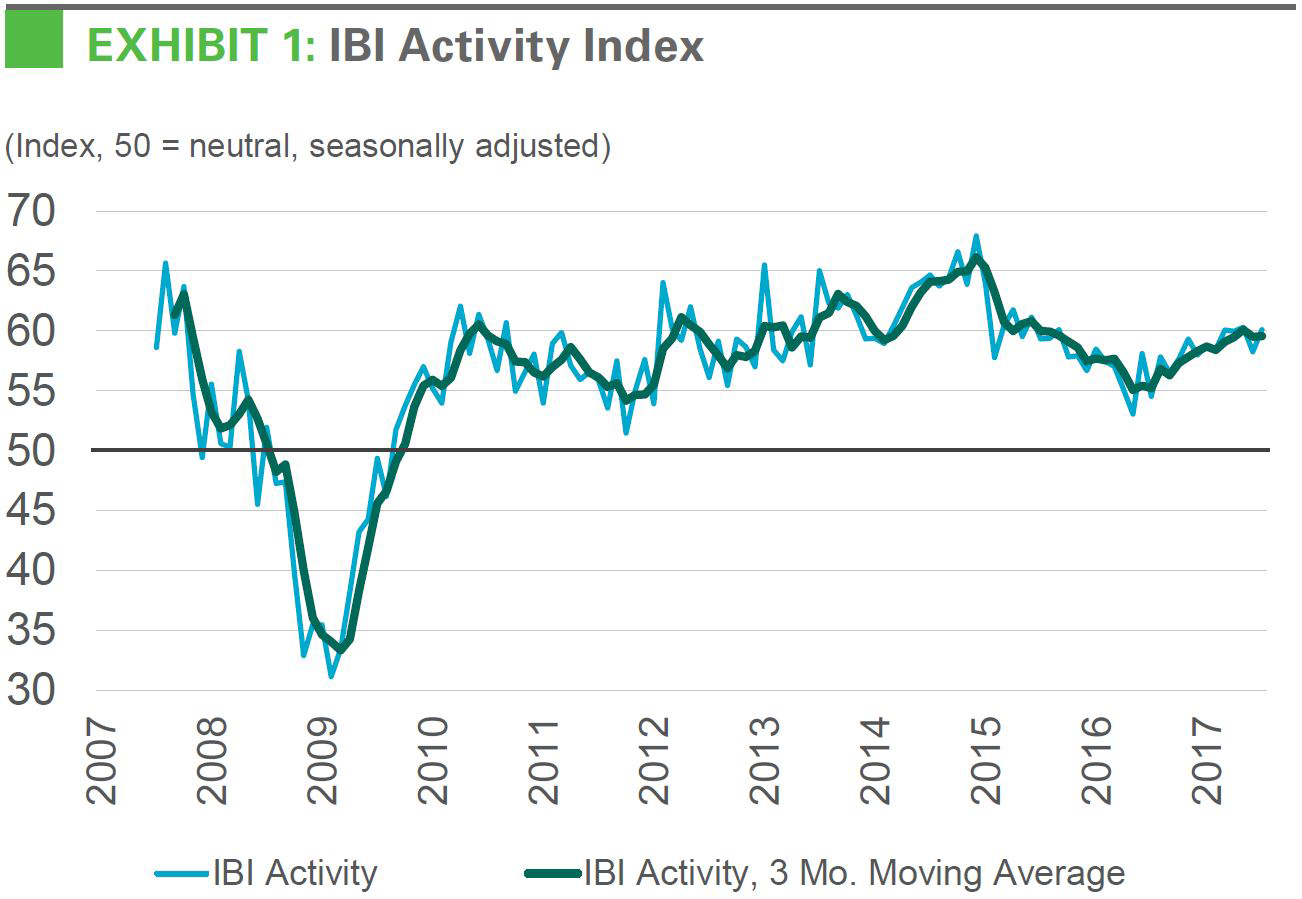
The IBI leads cyclical trends. The IBI was introduced at a pivotal moment for the U.S. economy and logistics real estate. A diffusion index, with readings above 50 signifying growth, the IBI activity index hovered in the high 50s/low 60s for the first few months. The first result below 50 (indicating slowing activity in logistics facilities) was in December 2007—just as logistics demand, GDP and employment were reaching their cyclical highs2 — presaging the downturn to come in 2008 and 2009. Readings continued to lead the cycle both through the downturn and the subsequent recovery.
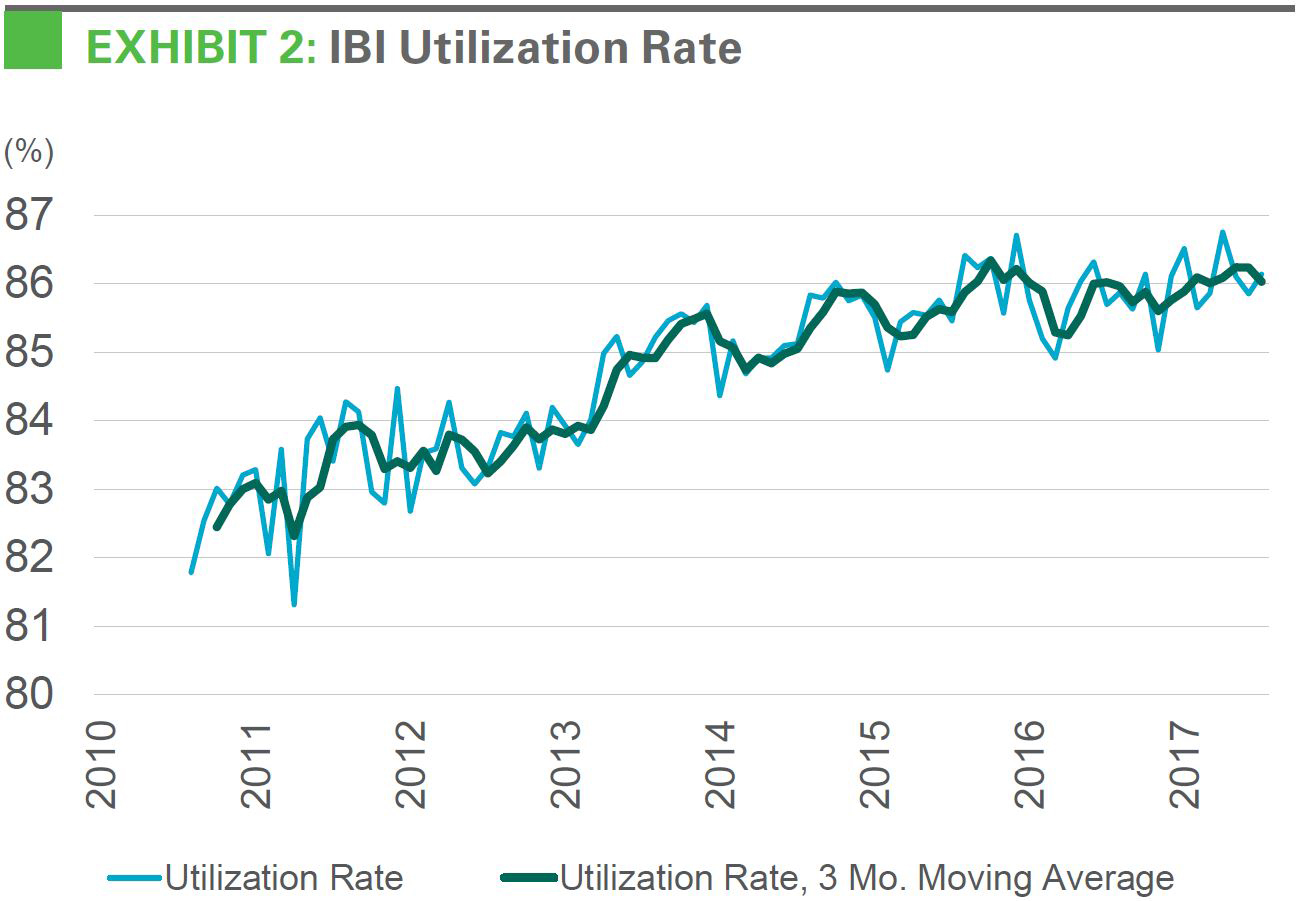
Supply chain efficiency is more important than ever. In addition to predicting the cycle, the Prologis IBI reflects shifting sentiment within the logistics industry. Over the past several decades, supply chains have evolved into a crucial competitive advantage for our customers. When leasing space, they increasingly staff or consult with supply chain experts with an eye toward maximizing the value of leased space. Today, leasing decisions are more often made in the context of the broader supply chain, which includes managing the other (larger) costs—labor and transportation—to enable higher service levels. The IBI reveals that space usage has become more efficient over time and that logistics real estate users currently have little shadow space. The utilization rate has steadily trended upward over the past decade and currently hovers near an all-time peak of about 86%.
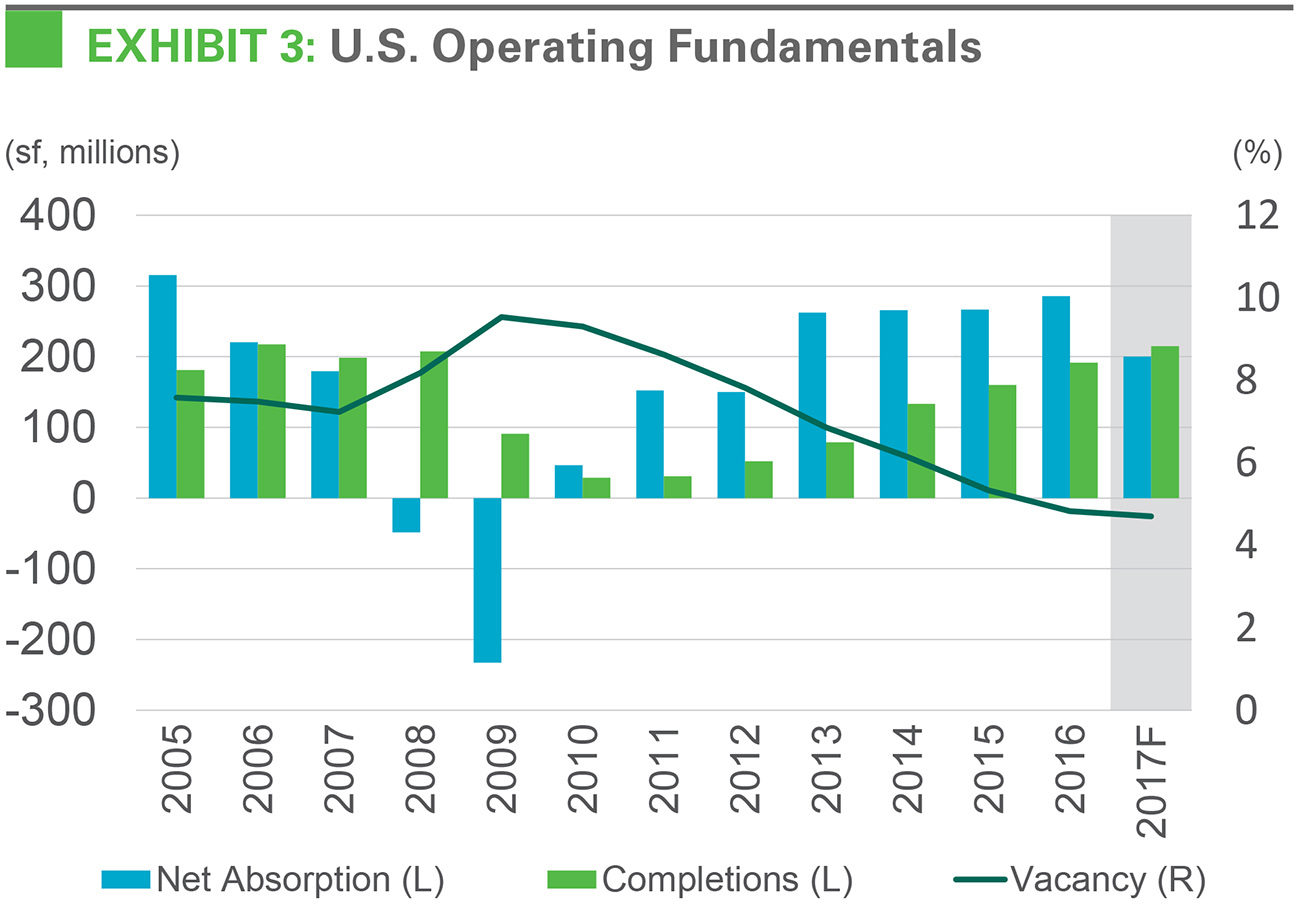
Our IBI reflects outperformance of logistics real estate. Net absorption has averaged more than 250 million square feet annually for the past four years.3 At the same time, real GDP growth has averaged 2.2%.4 Based on historical trends, this level of economic growth should have generated about 150 to 200 million square feet of logistics demand annually, or more than 20% less than was realized. Other economic indicators were similarly subdued. However, the IBI signaled higher levels of demand, with an average reading above 60 during the same period—indicating annual demand in the 225-250 million square foot range and showcasing its stronger relationship with realized net absorption than conventional economic metrics.
Business Highlights
The U.S. logistics real estate operating environment is healthy. Customers remain active, as demand drivers—including consumption, e-commerce and trade flows—record solid growth.5 The latest IBI activity reading came in at 60.1 in July 2017, consistent with robust logistics real estate demand growth. However, the lack of available space in many markets is constraining customers’ ability to grow. Customers cannot find the space to expand, particularly in prime locations along the coasts, where vacancies are at the current historical lows and demand is healthy. Competition for scarce available space is fueling strong market rent growth, which re-accelerated in early 2017 relative to last year and is on pace to approach 8% growth in the U.S.6
Sustained low vacancies mean that customers with the ability to plan ahead stand the best chance of securing space. Looking ahead, supply will rise to meet demand in markets where land is available for new development. However, large tracts of entitled land in the configuration and location that customers require is increasingly hard to find. In aggregate, new supply may continue to fall short of demand generated from population growth, economic expansion and structural changes. Consequently, net absorption will move in tandem with completions as new supply is rapidly leased up in most markets. As a result, the U.S. vacancy rate should remain near its historic low of 4.6%.7
Latest Findings
Customers are busier and are utilizing nearly all their space. The headline IBI activity index has stabilized near 60 since the beginning of 2017, following a slowdown in mid-2016. At the same time, the utilization rate has remained near its all-time high of 86%. Typically, space utilization tends to decline in the latter part of the cycle as logistics real estate users build out their distribution networks. However, current availability constraints may be producing higher-than-normal utilization rates as customers try to pack more activity into their existing supply chains given the lack of additional space alternatives.
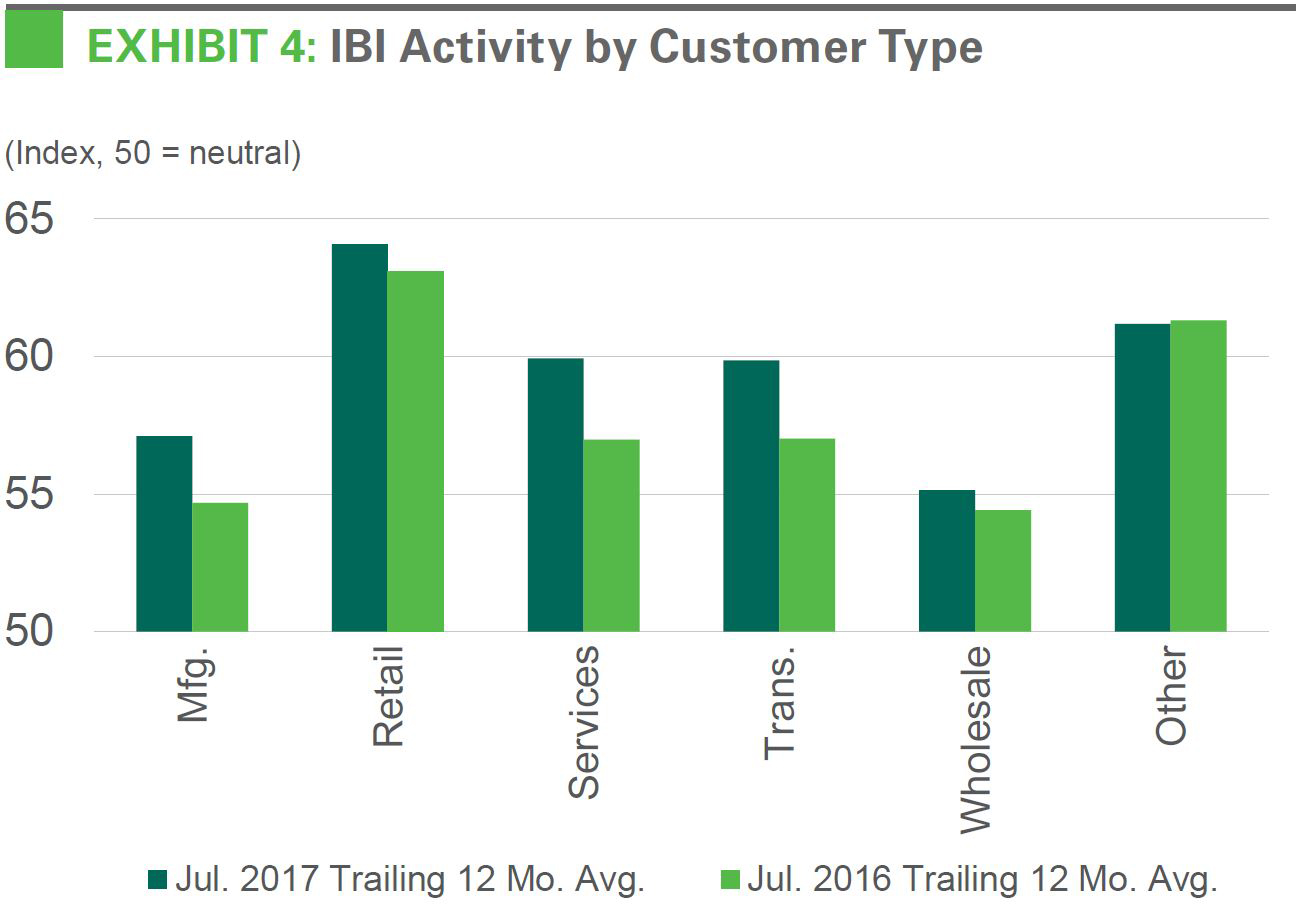
Demand is growing across a range of customers. Improvement in the IBI activity index was broad-based by industry and region. Among the largest customer types, retailers and transportation companies recorded the strongest growth and the fastest acceleration in activity between Q2’16 and Q2’17. Among U.S. regions, customers in the West region tend to have the highest utilization rates, and they have recorded a faster rise in activity in the past year.
The supply pipeline is rising to meet demand. The pipeline of space under construction increased to 218 million square feet in Q2’17.8 With a few exceptions, new supply is aligned with demand. One exception is that key logistics markets along the coasts are generally undersupplied. Market conditions in the San Francisco Bay Area, Los Angeles and New Jersey/New York City, for example, are very tight and new supply lags demand. On the other hand, there are a few pockets of potential oversupply primarily due to low barriers to new development. Locations to monitor closely include Louisville, Columbus, Central Pennsylvania, and South Dallas. In most other markets, new supply appears poised to roughly match the pace of demand.
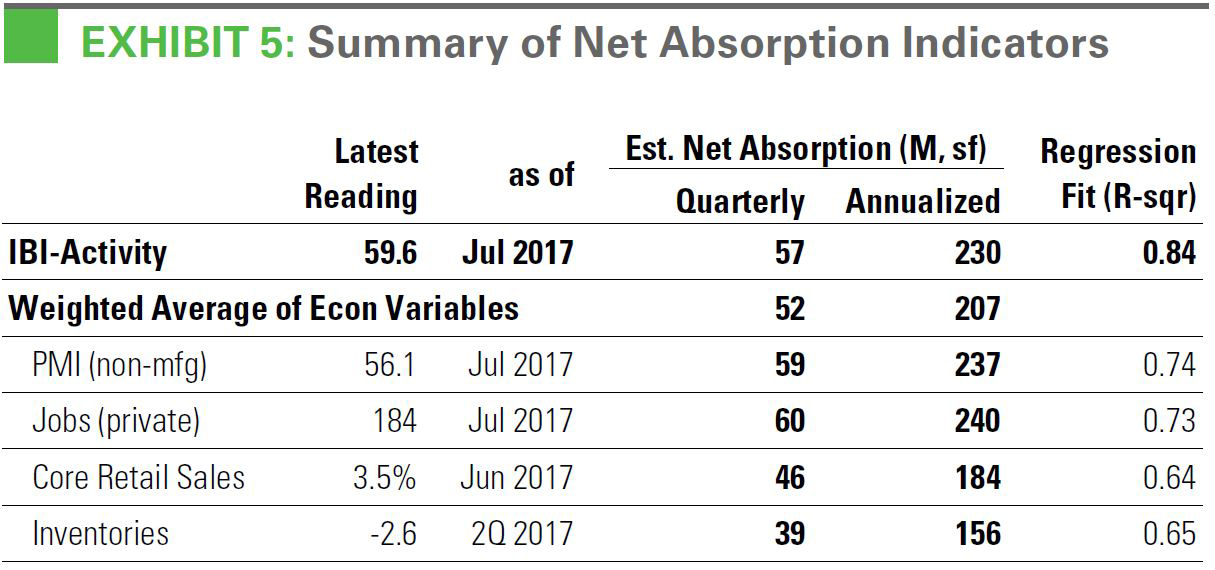
Securing space will likely remain difficult through the near term. A July 2017 survey from Consensus Economics reveals a forecast for real GDP growth of 2.2% in 2017 and 2.3% in 2018, similar to pre-election expectations. Our regression analysis of the IBI and other key leading indicators suggests that current economic conditions support logistics real estate demand growth of about 200 to 250 million square feet. However, persistent low vacancy will cause net absorption and completions to move in tandem through the near term. Prologis Research projects 200 million square feet of net absorption and 215 million square feet of completions in 2017. This supply/demand dynamic should hold through 2018, when we expect 215 million square feet of net absorption and 235 million square feet of completions.
Barriers to development will matter more as the expansion continues. In coastal markets, sustained low vacancy will continue to spur fierce competition for space, pushing market rents higher. Rent growth in these coastal markets should approach 10% in 2017. In markets where it is easier to build, customers should get some relief as more new supply comes online. Throughout the U.S., market rent growth has accelerated in 2017, with the fastest growth concentrated in the largest population centers with barriers to supply. Overall, our IBI and other economic indicators point to continued growth for logistics real estate occupiers, but a lack of availabilities will drive up costs in the most attractive markets and could potentially constrain expansion activity.
Endnotes
2. CBRE-EA, U.S. Bureau of Labor Statistics, U.S. Bureau of Economic Analysis, Prologis Research
3. CBRE-EA
4. U.S. Bureau of Economic Analysis
5. U.S. Bureau of Economic Analysis, U.S. Census, various port authorities
6. Prologis Research
7. CBRE-EA
8. CBRE, CBRE-EA, Cushman & Wakefield, Jones Lang LaSalle, Colliers
