Recap: Prologis’ latest proprietary survey of logistics real estate users, the Industrial Business Indicator, or IBI, points to robust activity across U.S. logistics facilities. These results are reflected in strong net absorption in the third quarter of 2018—which totaled 76 million square feet.1 In turn, intensifying competition for limited space is pushing market rents to new peaks.2
Market conditions are likely to remain challenging for customers looking to expand; Prologis Research increased rent growth expectations for 2019. We forecast demand moving slightly ahead of supply in 2018, with 260 million square feet of net absorption and 250 million square feet of new product. Demand and supply should roughly match through 2019, keeping the vacancy rate at its historic low of 4.5 percent in the near term and putting further upward pressure on rents.
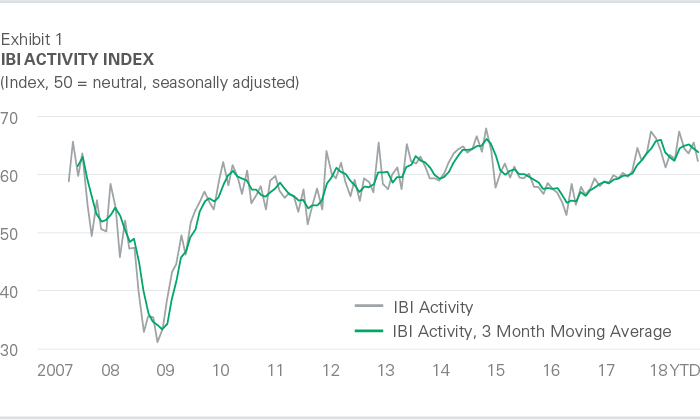
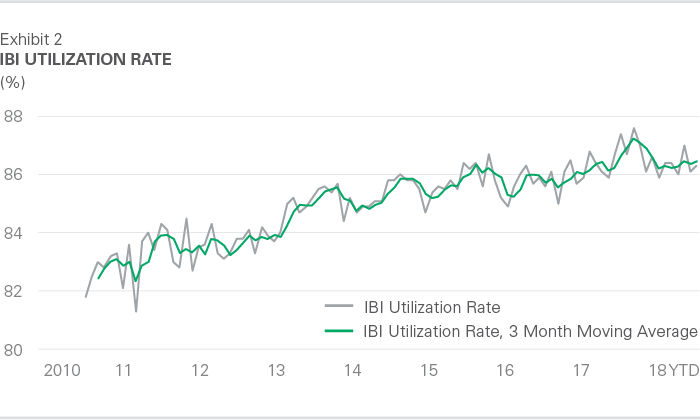
Customers are still in growth mode. The IBI activity index hit 62.3 in September 2018, consistent with last September’s reading (see Exhibit 1). Since July 2017, the IBI has stayed above 60, indicating strong growth in the flow of goods through U.S. logistics facilities (readings above 50 signify growth). At the same time, the utilization rate has averaged 86.5%—a heightened level (see Exhibit 2). Leading economic indicators show that logistics customers operating at or beyond capacity are simply going to need more space. Our regression model of leading indicators, including the IBI, suggests a current demand run rate of about 250 to 290 million square feet (see Exhibit 3).
Momentum varies among industries and regions. Although all industries are solidly in growth mode, the latest results suggest a slowdown for retail customers over the past year even as all other customer industries have accelerated (see Exhibit 4). There is a similar trend among U.S. regions, with the pace of growth accelerating in the East and Central regions and decelerating in the West (see Exhibit 5). Yet, the utilization rate in the West region soared to 88% in September, following an activity reading of more than 67 in the second quarter of 2018. Prologis Research had expected some volatility in these metrics due to new international trade policies, which appear to have distorted seasonal patterns of inventory re-stocking for domestic wholesalers and retailers. This trend is also supported by import statistics, business surveys and other economic indicators.3
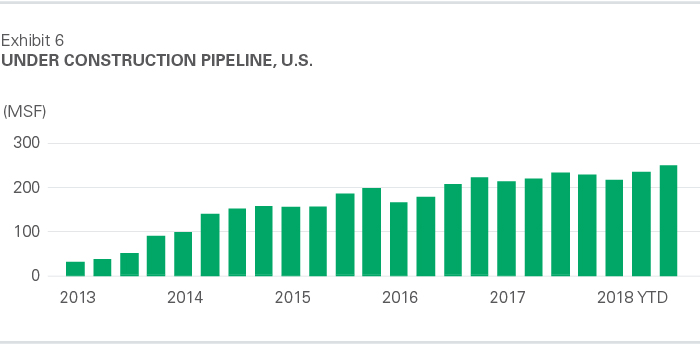
A few select locations are likely to see development opportunities. As market rents reach new peaks across the U.S., developers are responding, albeit gradually, with more spec product. The pipeline of space under construction rose to 249 million square feet in the third quarter, up from 229 million square feet in the prior year (see Exhibit 6). Given the strength of current and expected demand, Prologis Research anticipates that net new supply is unlikely to meet the need for space on an aggregate level. However, an elevated level of speculative bulk space under construction could create a mismatch between supply and demand in outlying low-barrier-to-entry submarkets such as Atlanta, Pennsylvania, Chicago, Dallas and Houston. Space should remain very limited in high-barrier coastal markets like Los Angeles, New Jersey/New York, the San Francisco Bay Area and Seattle.
Customers are likely to face continued challenges from persistent low vacancies. Strong competition for few availabilities is driving market rent growth. The combination of scarcity and rising costs is unlikely to abate in the near term. Prologis Research forecasts 265 million square feet of demand and 275 million square feet of supply in 2019 (see Exhibit 7), with logistics real estate users absorbing space as it comes online. The vacancy rate should remain at 4.5%, driving further competition for limited availabilities, while rising replacement costs will force developers to seek higher rents. As a result, customers who proactively plan for expansion and secure the best space quickly will be able to better navigate this difficult market environment.
Endnotes
2. Prologis Research
3. Ports of Los Angeles/Long Beach, Institute for Supply Management, U.S. Bureau of the Census


