Asia
China
Rent growth in China slowed throughout 2022, ending with 0.2% growth year-over-year, a deceleration from historical growth of around 4-5% annually. While deliveries stayed near a record high of 103 MSF, strict COVID-19 lockdowns beginning in Q2 constrained demand, causing the national vacancy rate to drift upward to 198% from 16% at the end of 2021.ix Rent growth was higher in city clusters with land scarcity, and customers competed for limited available space. In city agglomerate centers, where vacancies ended the year around 10%, rents grew at 1.6%, whereas non-agglomerate metropolises with more than 20% vacancy recorded a decline of -2.5%.
Japan
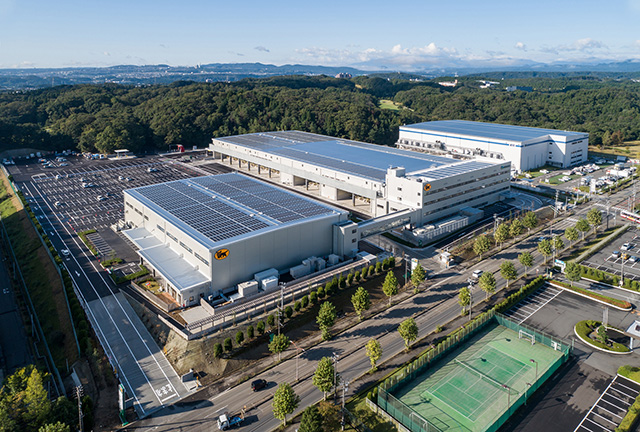
Rents grew a modest but historically consistent 1.4% year-over-year, slightly higher than the previous year’s growth just under 1%iv. High inflation (by Japan’s standards) has not flowed to rental pricing and remains low by global standards as the rate of inflation, excluding food and gas, remained around the 2% rangex. Deliveries climbed 26% to 52 MSF in 2022, exceeding record demand of 44 MSF.xi Vacancy rose to 3.4% but remained below the previous peak of 6% in 2017iv. Elevated development in regional markets, especially Nagoya, lifted vacancy rates and kept rent growth lower than Tokyo and Osaka.
Latin America
Mexico
Rents grew 16% across the top six Mexican markets in 2022. Juarez and Monterrey led with 25% year-over-year.iv Nearshoring investments are lifting demand with new supply slow to come online. Customers compete for few available spaces with vacancies on the border markets under 1% iv. This dynamic is likely to continue because land sites with sufficient energy availability in the border markets are scarce. Meanwhile, e-commerce continues to grow, underpinning demand in consumer-oriented markets, such as Mexico City, Guadalajara and Monterrey. The estimated e-commerce penetration rate of retail sales should reach 11-12% in 2022, up from 10% in 2021.xii
Brazil
Rents grew 10.8% across Sao Paulo and Rio de Janeiro, down from 13.2% in 2021iv on a nominal basis, but up on an inflation-adjusted basis (2.8% in 2021 versus 4.5% in 2022). The vacancy rate remained stable in the low teens (11%-13%) throughout the year due to counterbalancing factors. On one hand, tight monetary conditions reduced new developments significantly. On the other, customers signed smaller leases on average versus one year ago (50,000 versus 100,000 SF). Overall, flight to quality is the key driver for e-commerce and third-party logistics customers who are focused on locations close to end consumers and best-in-class quality buildings.
Endnotes
[i]Prologis Research tracks rental rates on a net effective basis. Net effective rents are headline rates adjusted for free rent. By doing so, we can capture changes in true economic lease terms. Real rates are adjusted by end of year inflation.
[ii] U.S. data from CBRE, C&W, JLL, Colliers, CBRE-EA, Prologis Research; Europe data from CBRE, C&W, JLL, Colliers, Fraunhofer, Gerald Eve, Prologis Research.
[iii] As of Q4 2022.
[iv] Source: Prologis Research.
[v] Source: Prologis Research, Federal Reserve Economic Data, Eurostat. Note: 24-month period as of Oct ‘22. Price index based on basket of commodities needed to develop a logistics warehouse. Basket weights are 47.5% for concrete, 27.1% for structural steel, 17% for roofing and paving, and 8.5% for fire protection pipe.
[vi] Source: CBRE, C&W, JLL, Colliers, CBRE-EA, Prologis Research.
[vii] Source: Prologis Research.
[viii] Source: CBRE, Gerald Eve, Fraunhofer, Prologis Research.
[ix] Source: JLL, Prologis Research.
[x] Source: Ministry of Internal Affairs and Communications.
[xi] Source: CBRE, Prologis Research.
[xii] Source: Morgan Stanley, Euromonitor


